Documentation Index
Fetch the complete documentation index at: https://docs.langsight.dev/llms.txt
Use this file to discover all available pages before exploring further.
Session Health & Status
Every session is automatically tagged with a health status after spans are ingested. The tag summarises what happened during the session and is the fastest way to triage failures across many runs.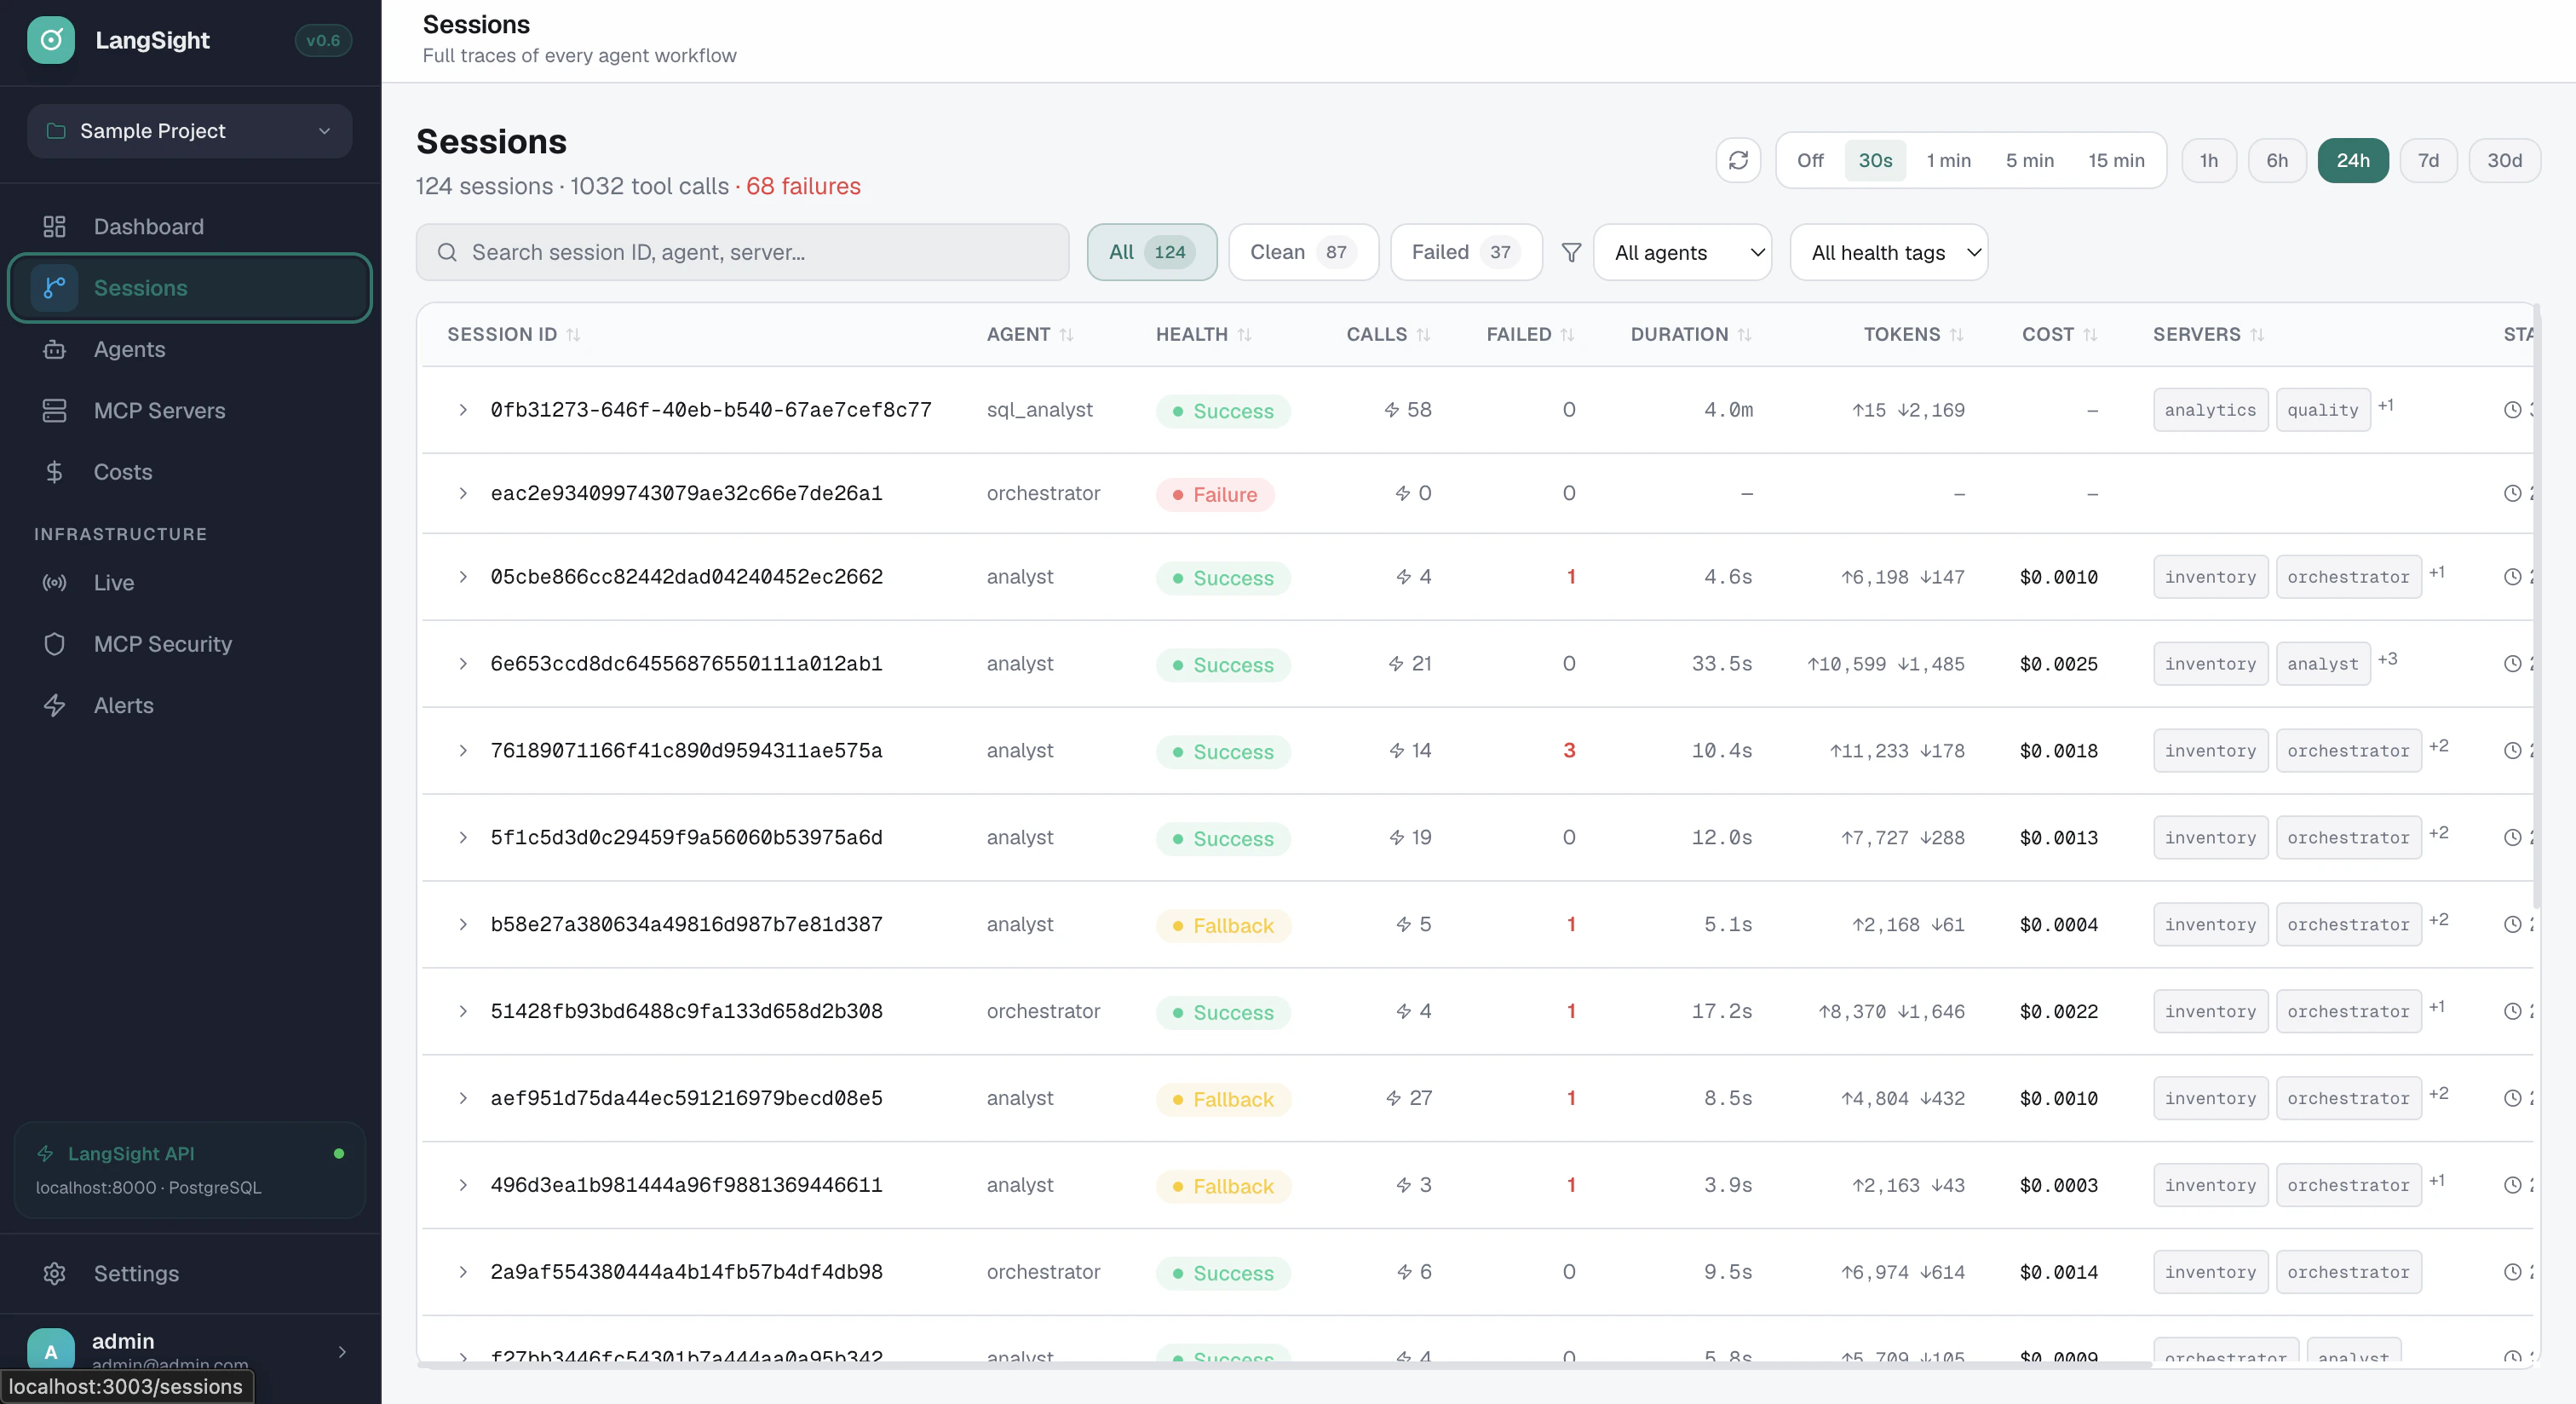
Health tags
| Tag | Colour | Meaning |
|---|---|---|
| success | Green | All tool calls and LLM generations completed without errors |
| success_with_fallback | Blue/Teal | At least one MCP tool call failed, but the agent retried and ultimately succeeded. The session completed but required recovery |
| tool_failure | Red | One or more tool calls or LLM generations failed and the session ended in an error state. The agent did not recover |
| timeout | Orange | At least one tool call timed out. The agent may have partially completed |
| loop_detected | Purple | The agent repeated the same tool call with the same arguments more than the configured threshold (default: 3 times). LangSight prevented further calls |
| budget_exceeded | Orange | The session exceeded its configured cost, step count, or wall-time budget. LangSight stopped further calls |
| circuit_breaker_open | Red | An MCP server was failing repeatedly and the circuit breaker opened — LangSight blocked further calls to protect the system |
| schema_drift | Yellow | An MCP tool’s schema changed since the last recorded snapshot. The tool’s input or output signature differs from what the agent expects |
| incomplete | Grey | The session started but stopped receiving spans before completing. The agent process likely crashed or was killed before finishing |
How tags are computed
Tags are computed server-side on every span batch ingestion. When multiple conditions apply to the same session, the highest-priority tag wins:loop_detected— any prevented span with a loop patternbudget_exceeded— any prevented span with a budget violationcircuit_breaker_open— any prevented span with a circuit breaker triggerschema_drift— any span with a schema drift errortimeout— any span with timeout statustool_failure— any span with error statussuccess_with_fallback— same MCP tool called multiple times with some failures, but ultimately succeededsuccess— all spans succeeded
LLM generation retries (for example, Gemini 503 errors) count as
tool_failure, not success_with_fallback. Retrying the LLM is not an MCP fallback — success_with_fallback is reserved for MCP tool-level recovery.Sessions page columns
| Column | What it shows |
|---|---|
| Session ID | Unique identifier. Click to open the full trace with lineage graph and span timeline |
| Agent | Primary agent name for this session |
| Health | Health tag badge — see table above |
| Calls | Total number of tool calls (MCP + LLM spans) |
| Failed | Number of calls that errored or timed out. Shown in red |
| Duration | Total session duration from first to last span |
| Tokens | Input and output token counts for all LLM calls in this session |
| Cost | Estimated cost based on token usage and model pricing |
| Servers | MCP servers used in this session |
| Started | When the session began |
Lineage graph node colours
On the session detail page, the lineage graph shows agent-to-MCP-server connections. Node border colours indicate whether errors occurred:| Border | Meaning |
|---|---|
| Green border | No errors in any span for this agent or server |
| Red border + glow | At least one span errored (tool call failure or LLM error) |
Filters on the Sessions page
| Filter | What it does |
|---|---|
| All / Clean / Failed | Filter by whether the session had any failed calls |
| All agents | Narrow to a specific agent name |
| Health tag | Show only sessions with a specific tag (e.g. only tool_failure sessions) |
| Date range | Filter by time window: 1h, 6h, 24h, 7d, or a custom range |
tool_failure sessions from the last 6 hours for a specific agent.
Triage workflow
A typical triage flow when something breaks overnight:- Open the Sessions page and set the date range to the relevant window
- Filter by Failed to exclude clean sessions
- Sort by Health to group sessions by tag (e.g. all
loop_detectedtogether) - Click the first failing session to open the trace
- In the Details tab, enable the Failures toggle (
e) to isolate the error chain in the lineage graph - Switch to the Trace tab to inspect the exact span that failed, including input args and error text
e) in the lineage graph to isolate the error chain, then filter the Sessions page to a known-good time window to inspect what changed between runs.