Documentation Index
Fetch the complete documentation index at: https://docs.langsight.dev/llms.txt
Use this file to discover all available pages before exploring further.
Overview
LangSight fires alerts through two independent pipelines: the CLI monitor (for MCP server health) and the API/Dashboard (for agent failures, anomalies, and security findings). Both pipelines write every fired alert to the Alert Inbox in the dashboard, where you can acknowledge, snooze, or resolve them. Every alert type can be toggled independently. Slack delivery is optional — the inbox always receives alerts regardless of whether Slack is configured.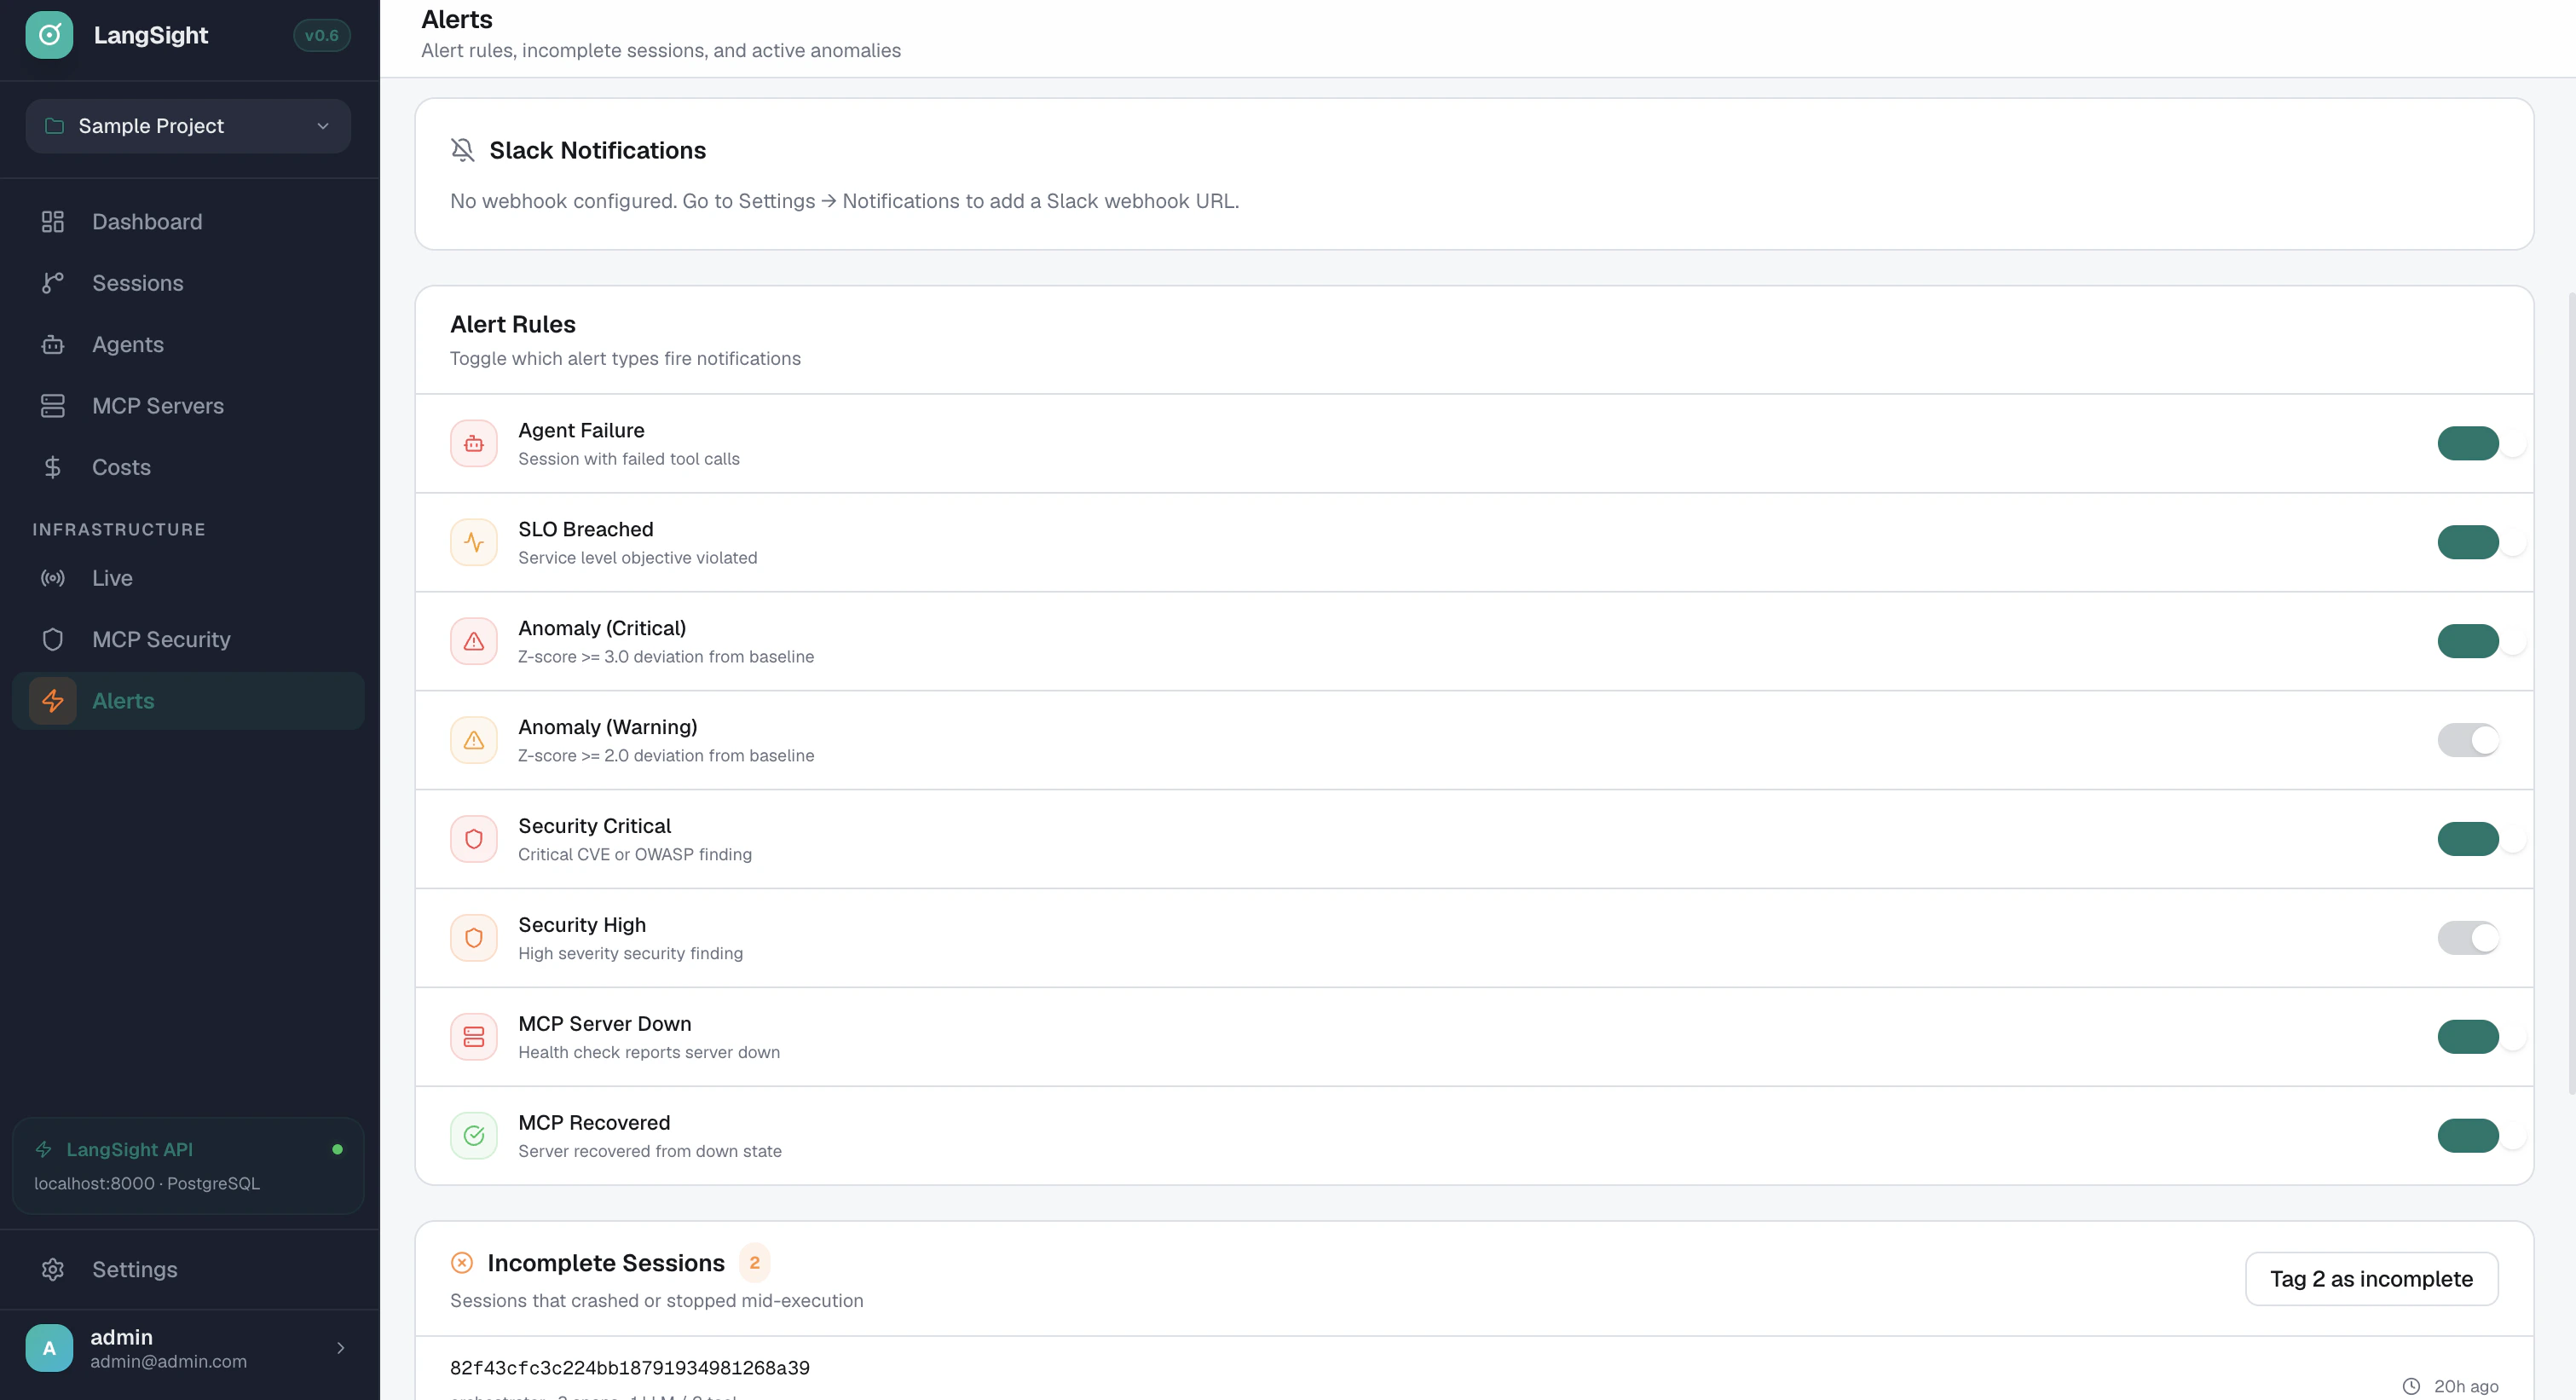
Step 1 — Create a Slack Incoming Webhook
You need a Slack Incoming Webhook URL before LangSight can deliver alerts. If you already have one, skip to Step 1b.Create or open a Slack App
Go to api.slack.com/apps and click Create New App → From scratch.
Give it a name (e.g.
LangSight Alerts) and select the workspace where alerts should appear.If you already have an existing Slack app you want to reuse, open it from the same page.Enable Incoming Webhooks
In your app settings, click Incoming Webhooks in the left sidebar, then toggle Activate Incoming Webhooks to On.
Add a webhook to your workspace
Scroll to the bottom of the Incoming Webhooks page and click Add New Webhook to Workspace.
Select the channel where LangSight alerts should be posted (e.g.
#alerts or #langsight), then click Allow.Incoming Webhooks guide
Official Slack guide to creating and managing incoming webhooks
Slack App management
Manage your Slack apps and webhook URLs
Block Kit message format
How LangSight formats rich alert messages in Slack
Slack help: Incoming Webhooks
Step-by-step help article for non-developers
Step 1b — Configure the webhook in LangSight
Option A: Dashboard (recommended)
- Open the dashboard and navigate to Settings → Notifications
- Paste your Slack Incoming Webhook URL into the Slack Webhook URL field
- Click Save, then click Test to send a test message
Option B: .langsight.yaml
Option C: Environment variable
Priority order
When all three are set, the webhook URL is resolved in this order:- Database (set via Settings → Notifications) — highest priority
.langsight.yamlalerts.slack_webhookLANGSIGHT_SLACK_WEBHOOKenvironment variable
Step 2 — Enable the alert types you want
Navigate to Dashboard → Alerts and use the toggles to enable or disable each alert type. Changes take effect immediately.| Toggle label | Config key | Default | Fired by |
|---|---|---|---|
| Agent Failure | agent_failure | ON | API — span ingestion with unhealthy health tag |
| SLO Breached | slo_breached | ON | API — SLO evaluator |
| Anomaly (Critical) | anomaly_critical | ON | API — anomaly detector |
| Anomaly (Warning) | anomaly_warning | OFF | API — anomaly detector |
| Security Critical | security_critical | ON | API — security scan |
| Security High | security_high | OFF | API — security scan |
| MCP Server Down | mcp_down | ON | CLI monitor |
| MCP Recovered | mcp_recovered | ON | CLI monitor |
Alert type toggles apply to Slack delivery only. All fired alerts are always written to the Alert Inbox regardless of toggle state.
Alert types — what fires and when
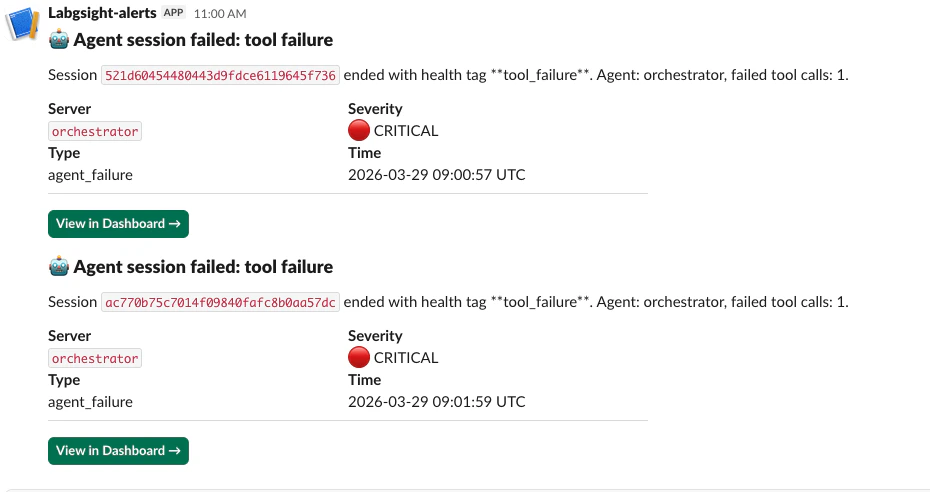
Agent Failure
Fires when a span batch is ingested via the API and any span carries an unhealthy health tag. Health tags that trigger this alert:| Tag | Meaning |
|---|---|
tool_failure | A tool call returned an error |
loop_detected | Agent exceeded the loop detection threshold |
budget_exceeded | Agent exceeded its configured cost or token budget |
circuit_breaker_open | Circuit breaker tripped — server in cooldown |
timeout | A tool call or LLM call exceeded the timeout |
schema_drift | Tool schema changed during an active session |
SLO Breached
Fires when the SLO evaluator determines that an agent has fallen below its success rate target or exceeded its p99 latency target. See Agent SLOs for how to define SLOs.Anomaly (Critical / Warning)
Fires when the anomaly detector identifies a statistically significant deviation from baseline for a tool’s error rate or latency. See Anomaly Detection for the z-score thresholds.- Critical: |z| >= 3.0
- Warning: |z| >= 2.0
Security Critical / Security High
Fires immediately after a security scan when findings at the corresponding severity are found. Security scans are manually triggered from the Alerts page or vialangsight security-scan. One alert fires per scan run — not per individual finding.
MCP Server Down
Fires from the CLI monitor (langsight monitor) when a server has failed health checks consecutively for the configured threshold (default: 3 consecutive failures). The alert fires once on the transition — not on every subsequent failed check.
MCP Recovered
Fires from the CLI monitor when a previously DOWN server passes a health check. Closes the incident automatically in the Alert Inbox.CLI monitor alerts
Thelangsight monitor daemon polls MCP servers continuously and fires alerts on state transitions.
Configurable thresholds
Alert types from the monitor
| Alert | Trigger |
|---|---|
MCP_DOWN | N consecutive failed health checks (N = consecutive_failures) |
MCP_RECOVERED | First passing check after a DOWN state |
SCHEMA_DRIFT | Tool schema changed between two consecutive checks |
HIGH_LATENCY | Latency exceeds latency_spike_multiplier × baseline |
Deduplication
The monitor tracks state per server.MCP_DOWN fires exactly once when the server transitions DOWN — not once per polling cycle. MCP_RECOVERED fires exactly once on the first passing check.
Alert Inbox
Every fired alert — from both the CLI monitor and the API — is written to the Alert Inbox. Access it at Dashboard → Alerts.Alert lifecycle
Actions
| Action | What it does |
|---|---|
| Ack | Marks the alert as reviewed. Stops it from appearing in the “Needs attention” count. |
| Snooze | Suppresses the alert for a fixed duration: 15 min, 1 hour, 4 hours, or 1 day. After the period, it returns to firing. |
| Resolve | Closes the alert. Resolved alerts are kept for audit purposes but removed from the active view. |
Inbox API
The inbox is also available via the REST API:Debugging — why didn’t my alert fire?
Check the structured logs on the API process. All alert activity is logged withstructlog:
| Log event | Meaning |
|---|---|
alert_dispatcher.skipped | Alert type is disabled in the dashboard toggle |
alert_dispatcher.save_failed | DB write failed — check storage connectivity |
alert_dispatcher.slack_sent | Slack delivery succeeded |
monitor.slack_sent | CLI monitor delivered to Slack |
Quick diagnostic checklist
- Is the alert type toggled on? — Dashboard → Alerts → check the toggle for the relevant type
- Is the webhook valid? — Settings → Notifications → click Test
- Check logs for
alert_dispatcher.skipped— the toggle is off - Check logs for
alert_dispatcher.save_failed— the Postgresfired_alertstable may be unreachable - For MCP Down alerts — is
langsight monitorrunning? Slack alerts for MCP servers require the monitor daemon, not just the API server
Testing alerts end-to-end
Test the Slack webhook
Settings → Notifications → Test button sends a test message immediately.Test MCP Down
Startlangsight monitor with a server that is deliberately unreachable:
consecutive_failures cycles (default 3), the DOWN alert fires and a Slack message is delivered.
Test agent_failure
Send a failing span via the SDK with an unhealthy tag:agent_failure alert should appear within seconds.
Test security alerts
Trigger a security scan from the Alerts page (or runlangsight security-scan). If any CRITICAL or HIGH findings are present, a security_critical or security_high alert fires immediately after the scan completes.
Architecture
AlertDispatcher. The inbox is the single source of truth for all alert history.